


This blog post was written to provide the reader with a visual, data driven look into the impact of the International Visitor Leadership Program (IVLP) administered by Meridian International Center over the past fiscal year. The data used are derived from internal record-keeping in the Professional Exchanges Division at Meridian. For FY16’s numbers, you can read the blog here.
Each fiscal year Meridian welcomes over 1,500 international visitors via the International Visitor Leadership Program (IVLP) on a professional exchange visit to the U.S. that could last from just a few days to three weeks. Our programming teams work closely with the U.S. Department of State and Global Ties U.S. Community Based Members (CBMs) to build outstanding programs that include not only meetings with counterparts, but also opportunities to get to know Americans in their homes and during volunteer events in local communities across the country. This blog entry is an effort to convey the diverse makeup of our visitors and their unique experiences.
In this past year, Meridian welcomed visitors from 164 nations, transnational organizations, and other territories. The map below provides a visual interpretation of these visitors and their respective origin countries.
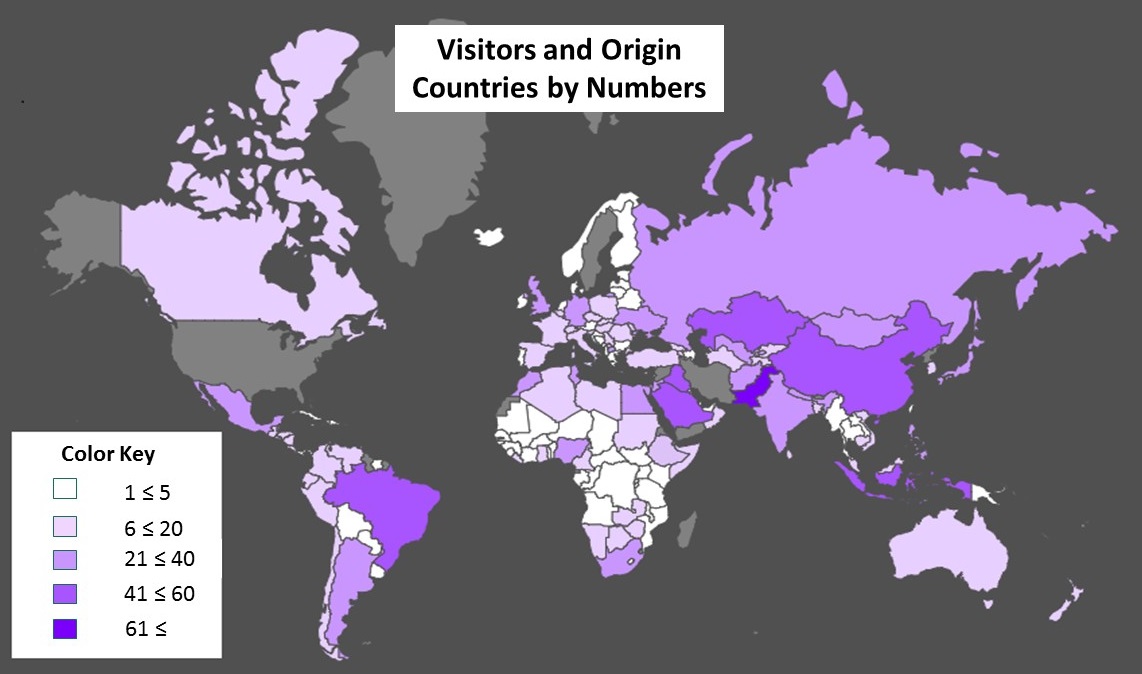
By most participants overall:
- Pakistan
- Saudi Arabia
- Brazil
- Iraq
- Kazakhstan
- People’s Republic of China
- Indonesia
- Egypt
- Argentina
- Russia
By participation and/or inclusion in the most projects overall:
- Egypt
- Saudi Arabia
- Iraq
- Pakistan
- Jordan
- India
- Algeria
- Tunisia
- Mexico
- Morocco
Next, we will take a look at thematic areas, or the reasons why these visitors traveled to the U.S. in FY17. Each project varied in size (some included just one visitor, while others included up to 30 participants) and overall theme. The following chart reveals the main project themes for the year.
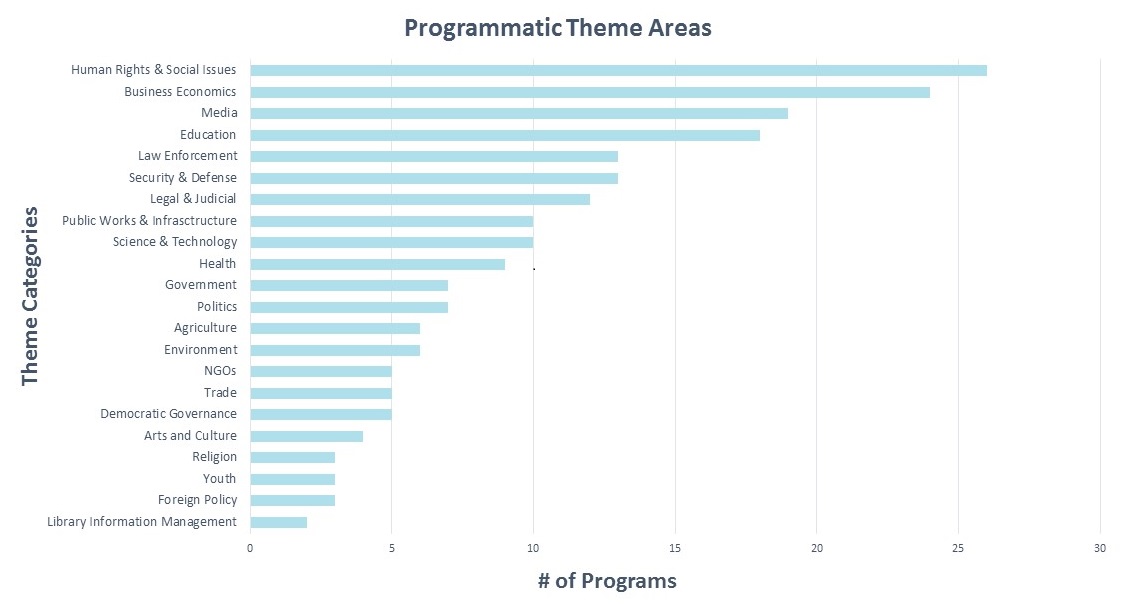
As the chart demonstrates, the most prominent categories were Human Rights and Social Issues, Business and Economics, Media, Education, and Law Enforcement. Projects under each heading cover a range of sub-topics, including:
Human Rights and Social Issues: LBGTQ Rights, Refugee Integration, Minority Issues
Business & Economics: Entrepreneurship, Women in Business, Economic Policy
Media: Digital Media, Traditional Media, Free Press
Education: STEM/STEAM, K-12, Administration
Law Enforcement: Combatting Violent Extremism, Conflict Resolution, and Human Trafficking
In addition to program themes and visitor numbers, we tracked home hospitality,* which provides an opportunity for visitors to sit down and share a meal with residents of the cities they visit. The American hosts are volunteers familiar with their local communities and eager to meet incoming participants in an informal setting. For this blog entry, we examined both national and local itineraries to identify cities that organized home hospitality for participants. The following image provides an idea of where participants had home hospitality during the last fiscal year.
*Not all CBMs are asked to arrange home hospitality. Numbers reflect those that were contacted for home hospitality and were able to organize it for visiting groups or individual international visitors.
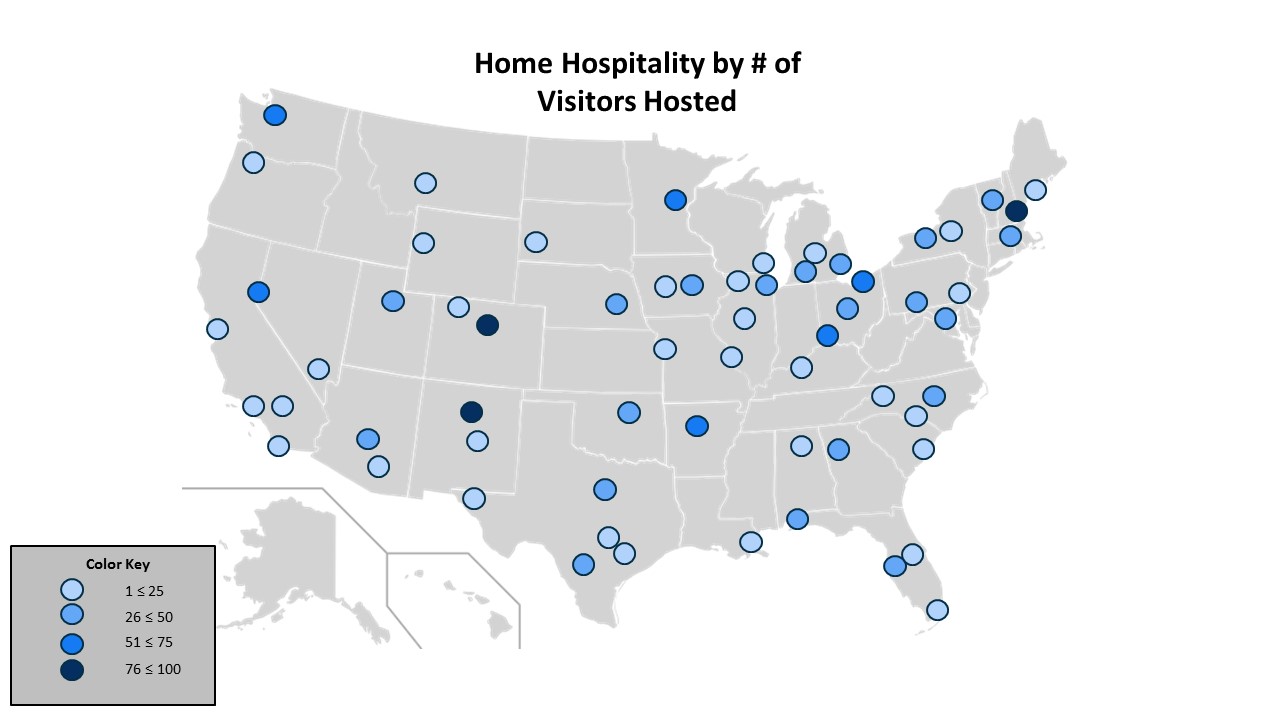
By Visitors Hosted:
- Denver
- Santa Fe
- Manchester
- Little Rock
- Minneapolis
- Reno
- Cincinnati
- Cleveland
- Seattle
- Burlington
By Hospitalities Organized:
- Denver
- Santa Fe
- Reno
- Manchester
- Minneapolis
- Cincinnati
- Cleveland
- Little Rock
- Atlanta
- Dallas
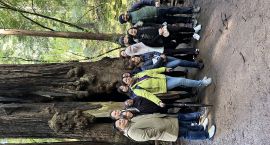
Finally, we sought to analyze the impact of volunteer activities* participants engaged in over the past year. We concluded that 405 visitors and 108 international visitor liaisons and/or interpreters worked to contribute a total of 1,125 service hours across the U.S. The following image provides an idea of where participants and liaisons volunteered, and the number of hours spent engaged in volunteer activities.
*Not all CBMs are asked to arrange volunteer opportunities. Numbers below reflect those that were contacted for volunteer opportunities and were able to organize it for visiting international participants.
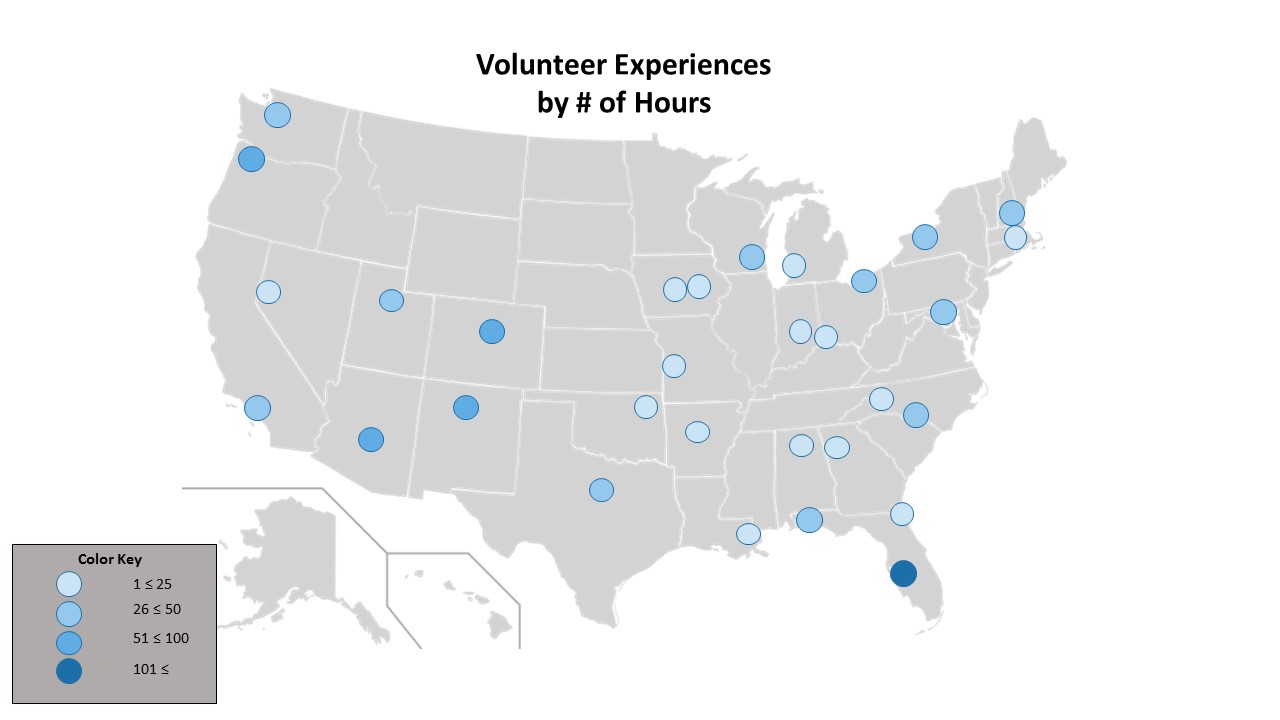
In total, 56 volunteer opportunities were organized in 31 cities. The greatest amount of volunteer hours were completed in Tampa/St. Petersburg. Portland, Cleveland, and Santa Fe were also responsible for a majority of hours served.
Participants engaged in activities such as helping to run the Bay View Bash’s Zero Waste Festival in Milwaukee, sorting medical supplies with Medwish International in Cleveland, sowing wild sea oats on the beaches of Tampa/St. Petersburg, assisting in the administrative duties for the Folk Art Festival in Santa Fe, and serving lunch to the homeless with Chief Seattle Club in Seattle.
If you enjoyed this journey through the past fiscal year, check out other, similar blog posts about the impact of the International Visitor Leadership Program at Meridian.
FY16 IVLP @ Meridian International Center: By the Numbers
Congressional Districts Visited by IVLP Participants in 2015
IVLP 75th Anniversary Time-lapse Map
Mapping IVLP Volunteer Service