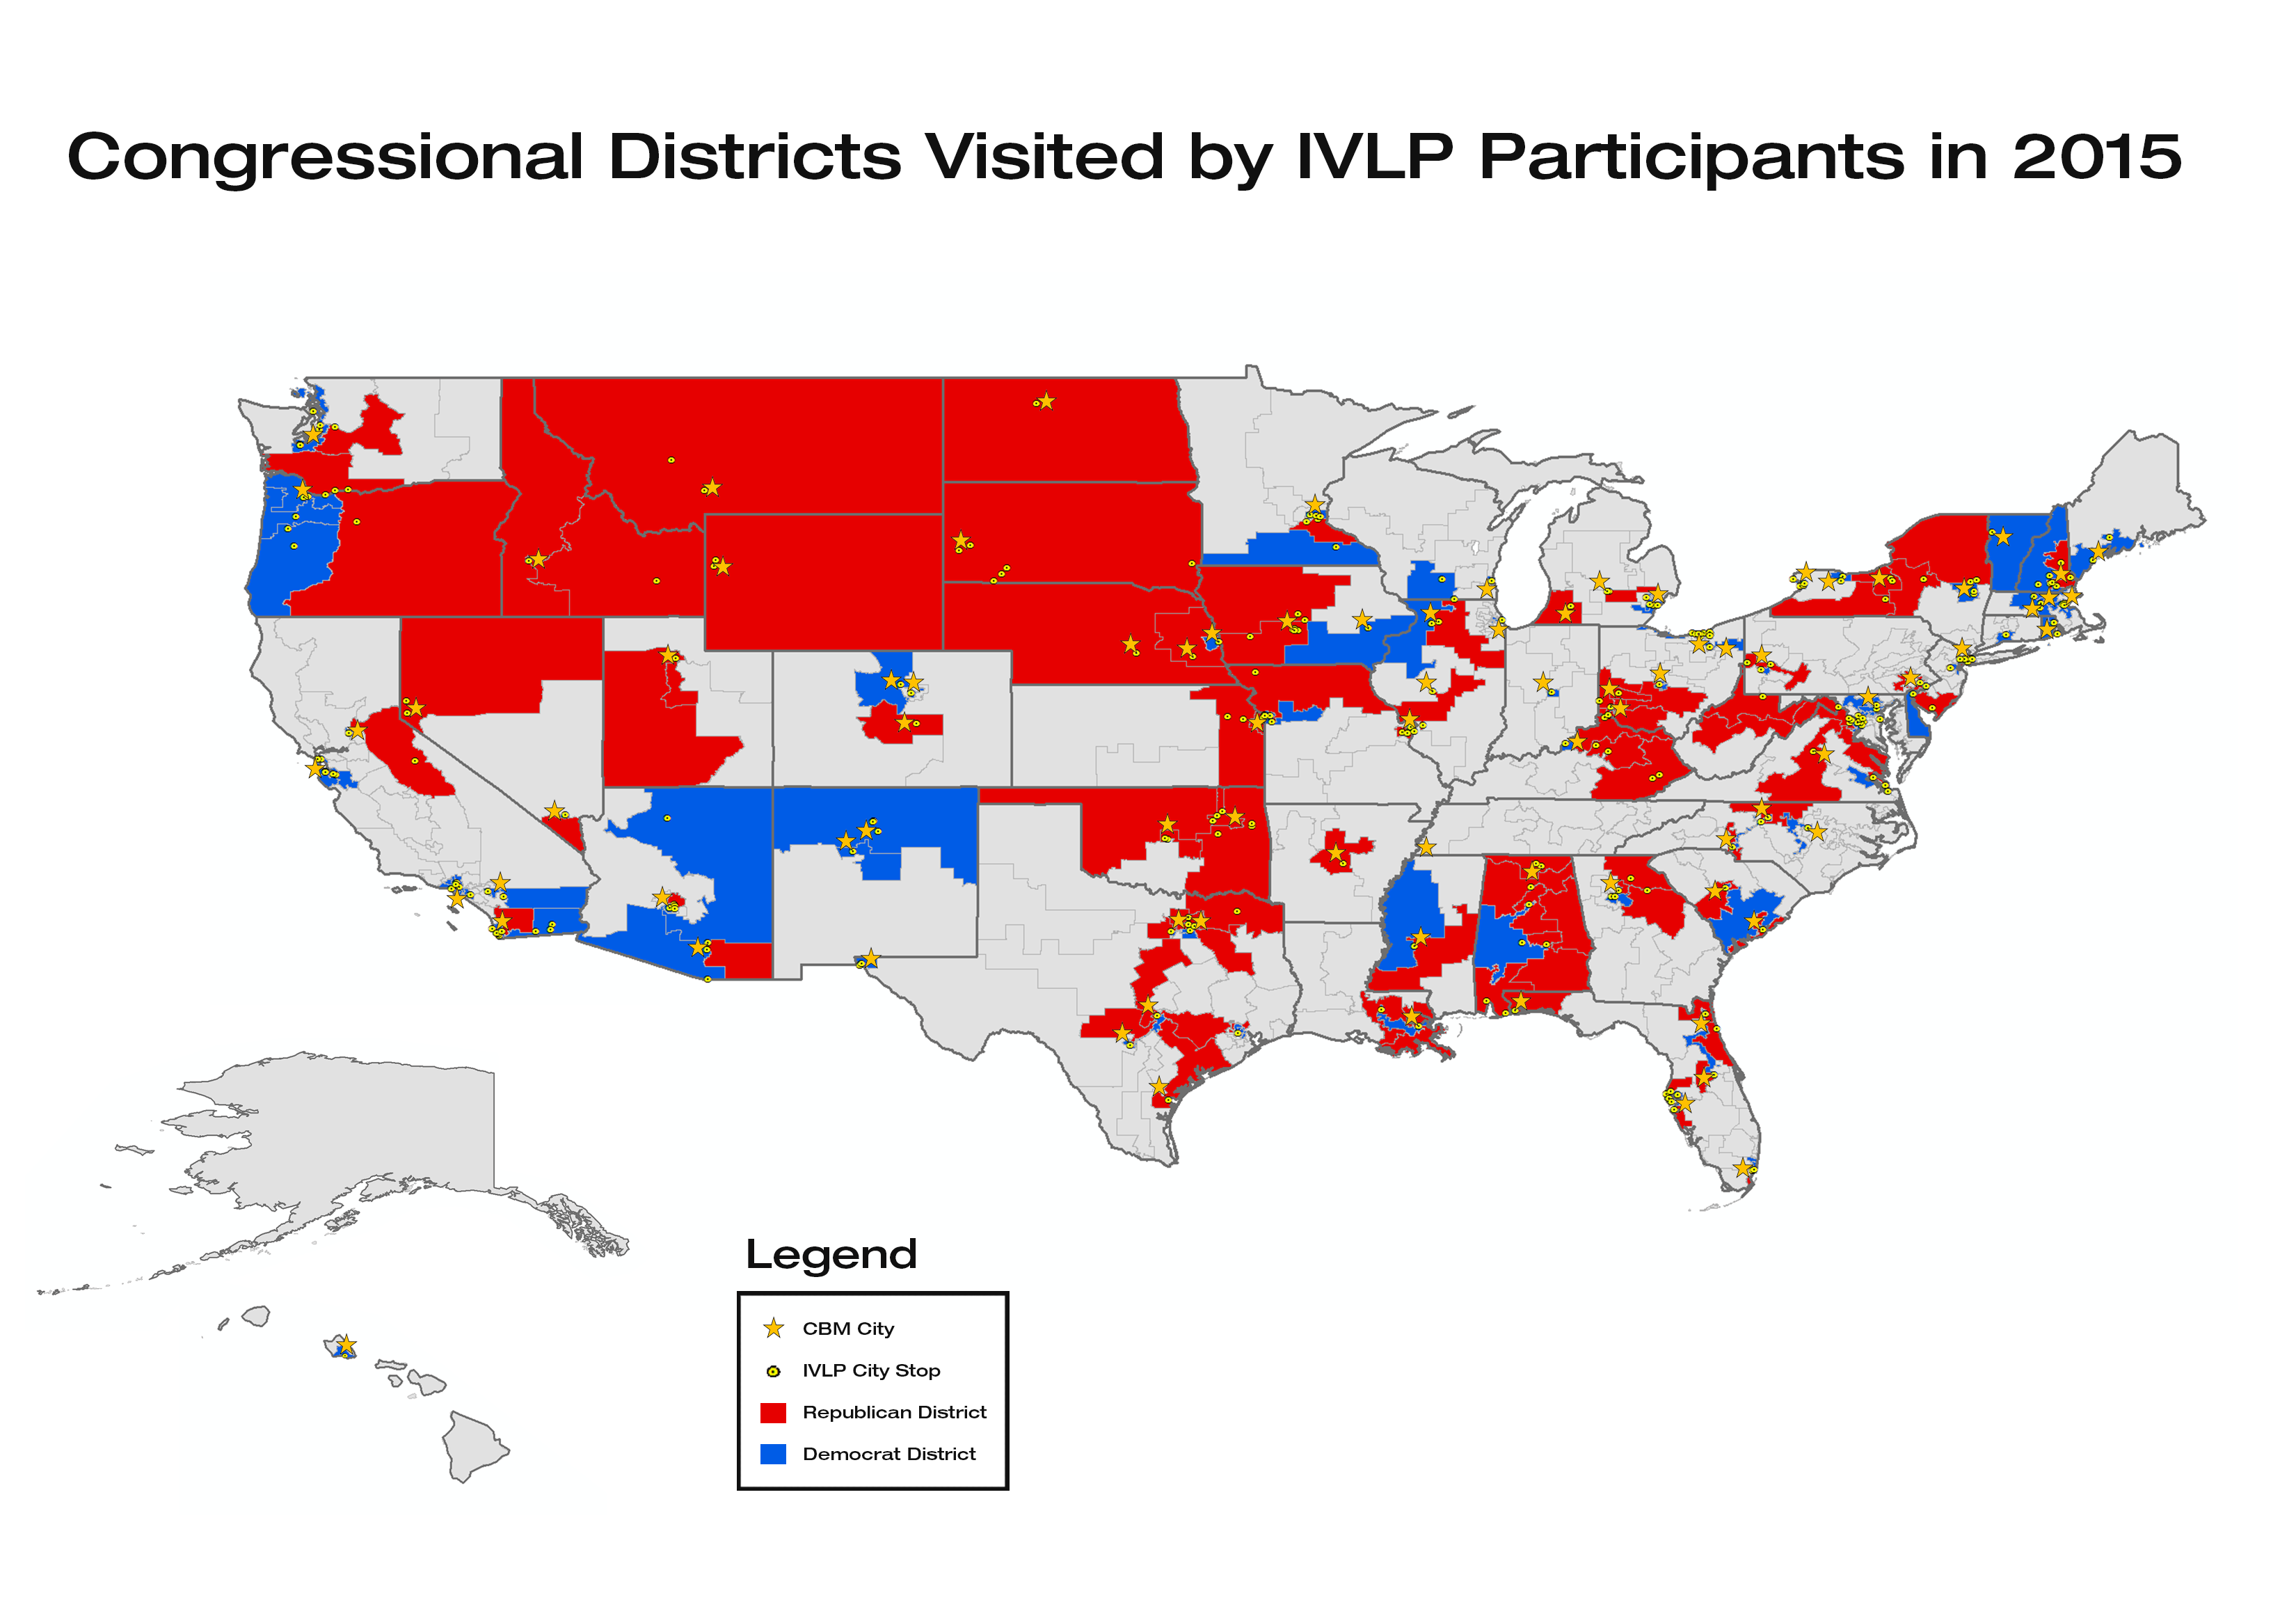
Each year, in order to track the geographic diversity of our programming, we collect a list of the cities that our visitors see as they travel across the country. Last marked the 75th Anniversary of the International Visitor Leadership Program. Using the list of cities from that year we constructed a map to visually show our visitors travels. Would the data points cluster near the coast or major cities? What if we overlaid it with congressional districts? How would the spread be with red and blue districts? In the following maps we tried to discover the answers to those questions and more and the results might be surprising.
The Global Ties network of community based members (CBM) coordinates programming for international visitors across the country. Some states have several CBMS while others have none like Alaska, Connecticut, Delaware, Kansas and West Virginia. The location of CBMs is marked with gold stars on the map. If a state lacks a CBM, coordinating local meetings becomes much harder.
The Results

Based on our data we discovered that of 435 total districts 213 districts or 49% were visited. Of those districts visited 119 were Democrat districts (56%) and 93 were Republican districts (44%). Of 190 total Democrat districts 63% were visited. Of 247 total Republican districts 38% were visited.
In reviewing the map it is evident, as expected that visitor travel clusters around CBMs. Perhaps the most surprising finding is visitor travel in Alabama which covered all of Alabama’s 7 congressional districts. In addition to Alabama, every congressional district was visited in eleven other states. Two states weren’t visited at all. The following chart has a quick summary.
| State | % Visited | Total Congressional Districts | |
| 1 | Alabama | 100% | 7 |
| 2 | Delaware | 100% | 1 |
| 3 | Idaho | 100% | 2 |
| 4 | Montana | 100% | 1 |
| 5 | Nebraska | 100% | 3 |
| 6 | New Hampshire | 100% | 2 |
| 7 | North Dakota | 100% | 1 |
| 8 | Oregon | 100% | 5 |
| 9 | Rhode Island | 100% | 2 |
| 10 | South Dakota | 100% | 1 |
| 11 | Vermont | 100% | 1 |
| 12 | Wyoming | 100% | 1 |
| 13 | Oklahoma | 80% | 5 |
| 14 | Iowa | 75% | 4 |
| 15 | Nevada | 75% | 4 |
| 16 | Kentucky | 67% | 6 |
| 17 | New Mexico | 67% | 3 |
| 18 | West Virginia | 67% | 3 |
| 19 | New York | 63% | 27 |
| 20 | Washington | 60% | 10 |
| 21 | Arizona | 56% | 9 |
| 22 | Massachusetts | 56% | 9 |
| 23 | Ohio | 56% | 16 |
| 24 | Virginia | 55% | 11 |
| 25 | Texas | 53% | 36 |
| 26 | Hawaii | 50% | 2 |
| 27 | Kansas | 50% | 4 |
| 28 | Louisiana | 50% | 6 |
| 29 | Maine | 50% | 2 |
| 30 | Maryland | 50% | 8 |
| 31 | Minnesota | 50% | 8 |
| 32 | Mississippi | 50% | 4 |
| 33 | Missouri | 50% | 8 |
| 34 | Utah | 50% | 4 |
| 35 | California | 49% | 53 |
| 36 | Florida | 44% | 27 |
| 37 | Colorado | 43% | 7 |
| 38 | South Carolina | 43% | 7 |
| 39 | Georgia | 36% | 14 |
| 40 | Michigan | 36% | 14 |
| 41 | New Jersey | 33% | 12 |
| 42 | North Carolina | 31% | 13 |
| 43 | Illinois | 28% | 18 |
| 44 | Pennsylvania | 28% | 18 |
| 45 | Arkansas | 25% | 4 |
| 46 | Wisconsin | 25% | 8 |
| 47 | Connecticut | 20% | 5 |
| 48 | Indiana | 11% | 9 |
| 49 | Alaska | 0% | 1 |
| 50 | Tennessee | 0% | 9 |
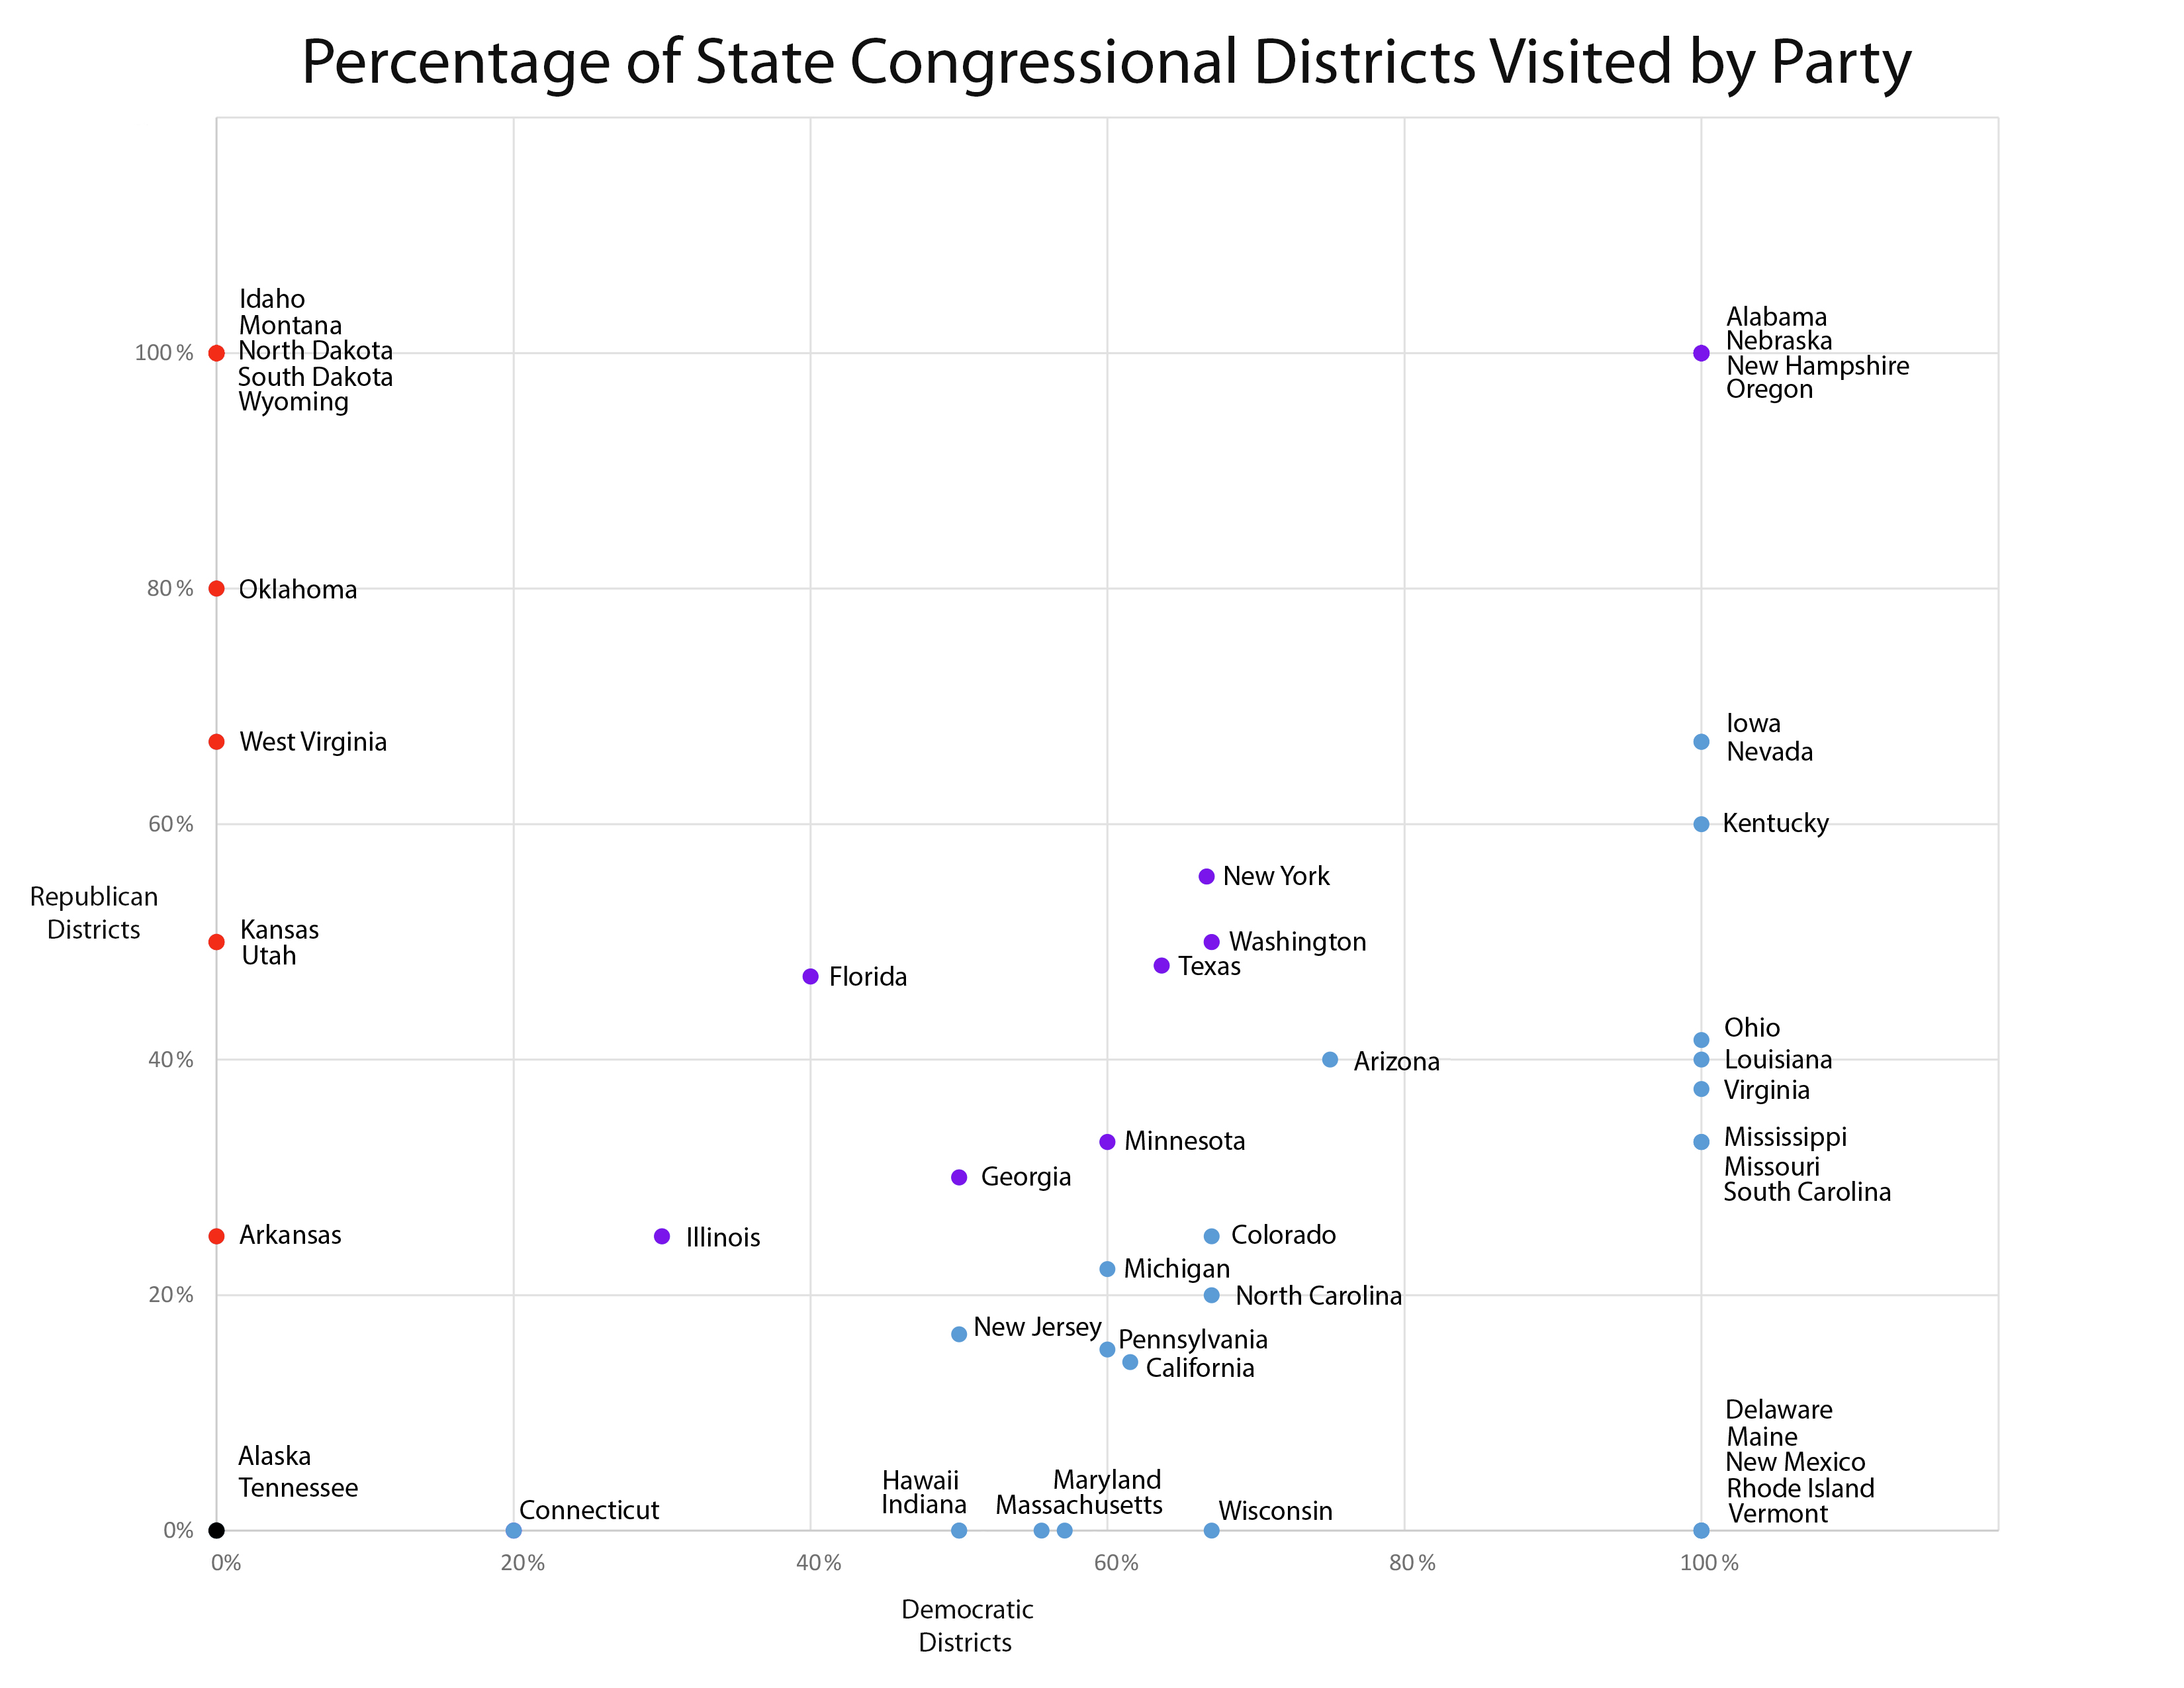
States vary in the number of red and blue districts. Are visitors only experiencing red or blue districts when they travel to a state? The following scatterplot helps to answer this question.

This blog is part of a series. The previous posts discuss the relationship between the IVLP and the rise in women leaders, another offers a profile of IVLP alumni that become heads of state and one more is a time-lapse video showing the origin of IVLP participants since 1950.


